A complete guide to data lineage diagrams
To how data moves through an organisation, data lineage diagrams
As data grows and transformations get more complex, it gets harder to really know your data.
The best starting place to make sure you really know your data is, well, your data’s starting place – wherever that may be. For data teams, it’s essential to know your data from the source throughout its entire lifecycle. But, as data moves and is transformed through the pipeline, it can become increasingly complex to trace its journey. So, how can data teams know this information?
Data lineage diagrams provide a clear map of the flow of data within an organisation. In this guide, we’ll dive into why data lineage diagrams matter, explore the different types you can use, and share tips on how to make the most of them to improve your data quality.
What is a data lineage diagram?
ℹ️ A data lineage diagram is a visual representation of how data flows through an organisation’s systems. It traces the data’s journey from its origin, through transformations, to its final destination.
Data lineage diagrams provide critical insights into the relationships between data sources, processes, and outputs, making it easier to asses the impact of changes, and maintain data quality across the organisation.
Upstream and downstream dependencies in data lineage diagrams
Data lineage diagrams provide visibility into both upstream and downstream dependencies, offering a clear picture of how data flows through systems.
Upstream dependencies
Upstream dependencies in data lineage diagrams represent the data sources or processes that feed into a specific dataset. Changes in upstream systems, such as modifications to source data or transformations, can have a significant impact on downstream data assets.
Example scenario: new data fields in source system
Take for example a retail company upgrading its point-of-sale (POS) system to capture extra customer details, like loyalty programme IDs and purchase timestamps. These new data fields need to be added to the upstream data collection process. To handle this, the data warehouse schema must be updated, and workflows adjusted to ensure the new data is properly ingested and transformed. Without clear visibility into upstream dependencies, these changes could cause issues in downstream analytics dashboards that rely on consistent data structures.
Downstream dependencies
Downstream dependencies in data lineage diagrams include the systems, models, or reports that rely on a particular dataset. Any alterations to the dataset can cascade through downstream applications, potentially affecting analyses, reports, or decision-making.
Example scenario: new reporting requirements
Imagine a financial institution updating its compliance reporting tool to include new metrics, like transaction risk scores and customer segmentation data, to meet updated regulations. This change relies on upstream systems to provide these additional data points. Data engineers need to update the upstream data pipelines to include the required fields and adjust transformations to deliver the data in the right format.
Without a clear view of downstream dependencies, important reports might fail or show incomplete results, creating compliance risks. By mapping these dependencies, it is easier to understand the impact of changes keep the data pipeline running smoothly.
Different types of data lineage diagrams
There are two different types of lineage diagrams: table-level and column-level lineage (also referred to as field-level lineage). The level of granularity you need depends on the scenario. Here’s a quick explanation of the different types of data lineage:
Table-Level data lineage diagrams
Table-level lineage diagrams show you how entire tables within the database or warehouse relate to each other. They are useful for identifying which tables are source or target tables, but they do not show you the transformations within the tables themselves.
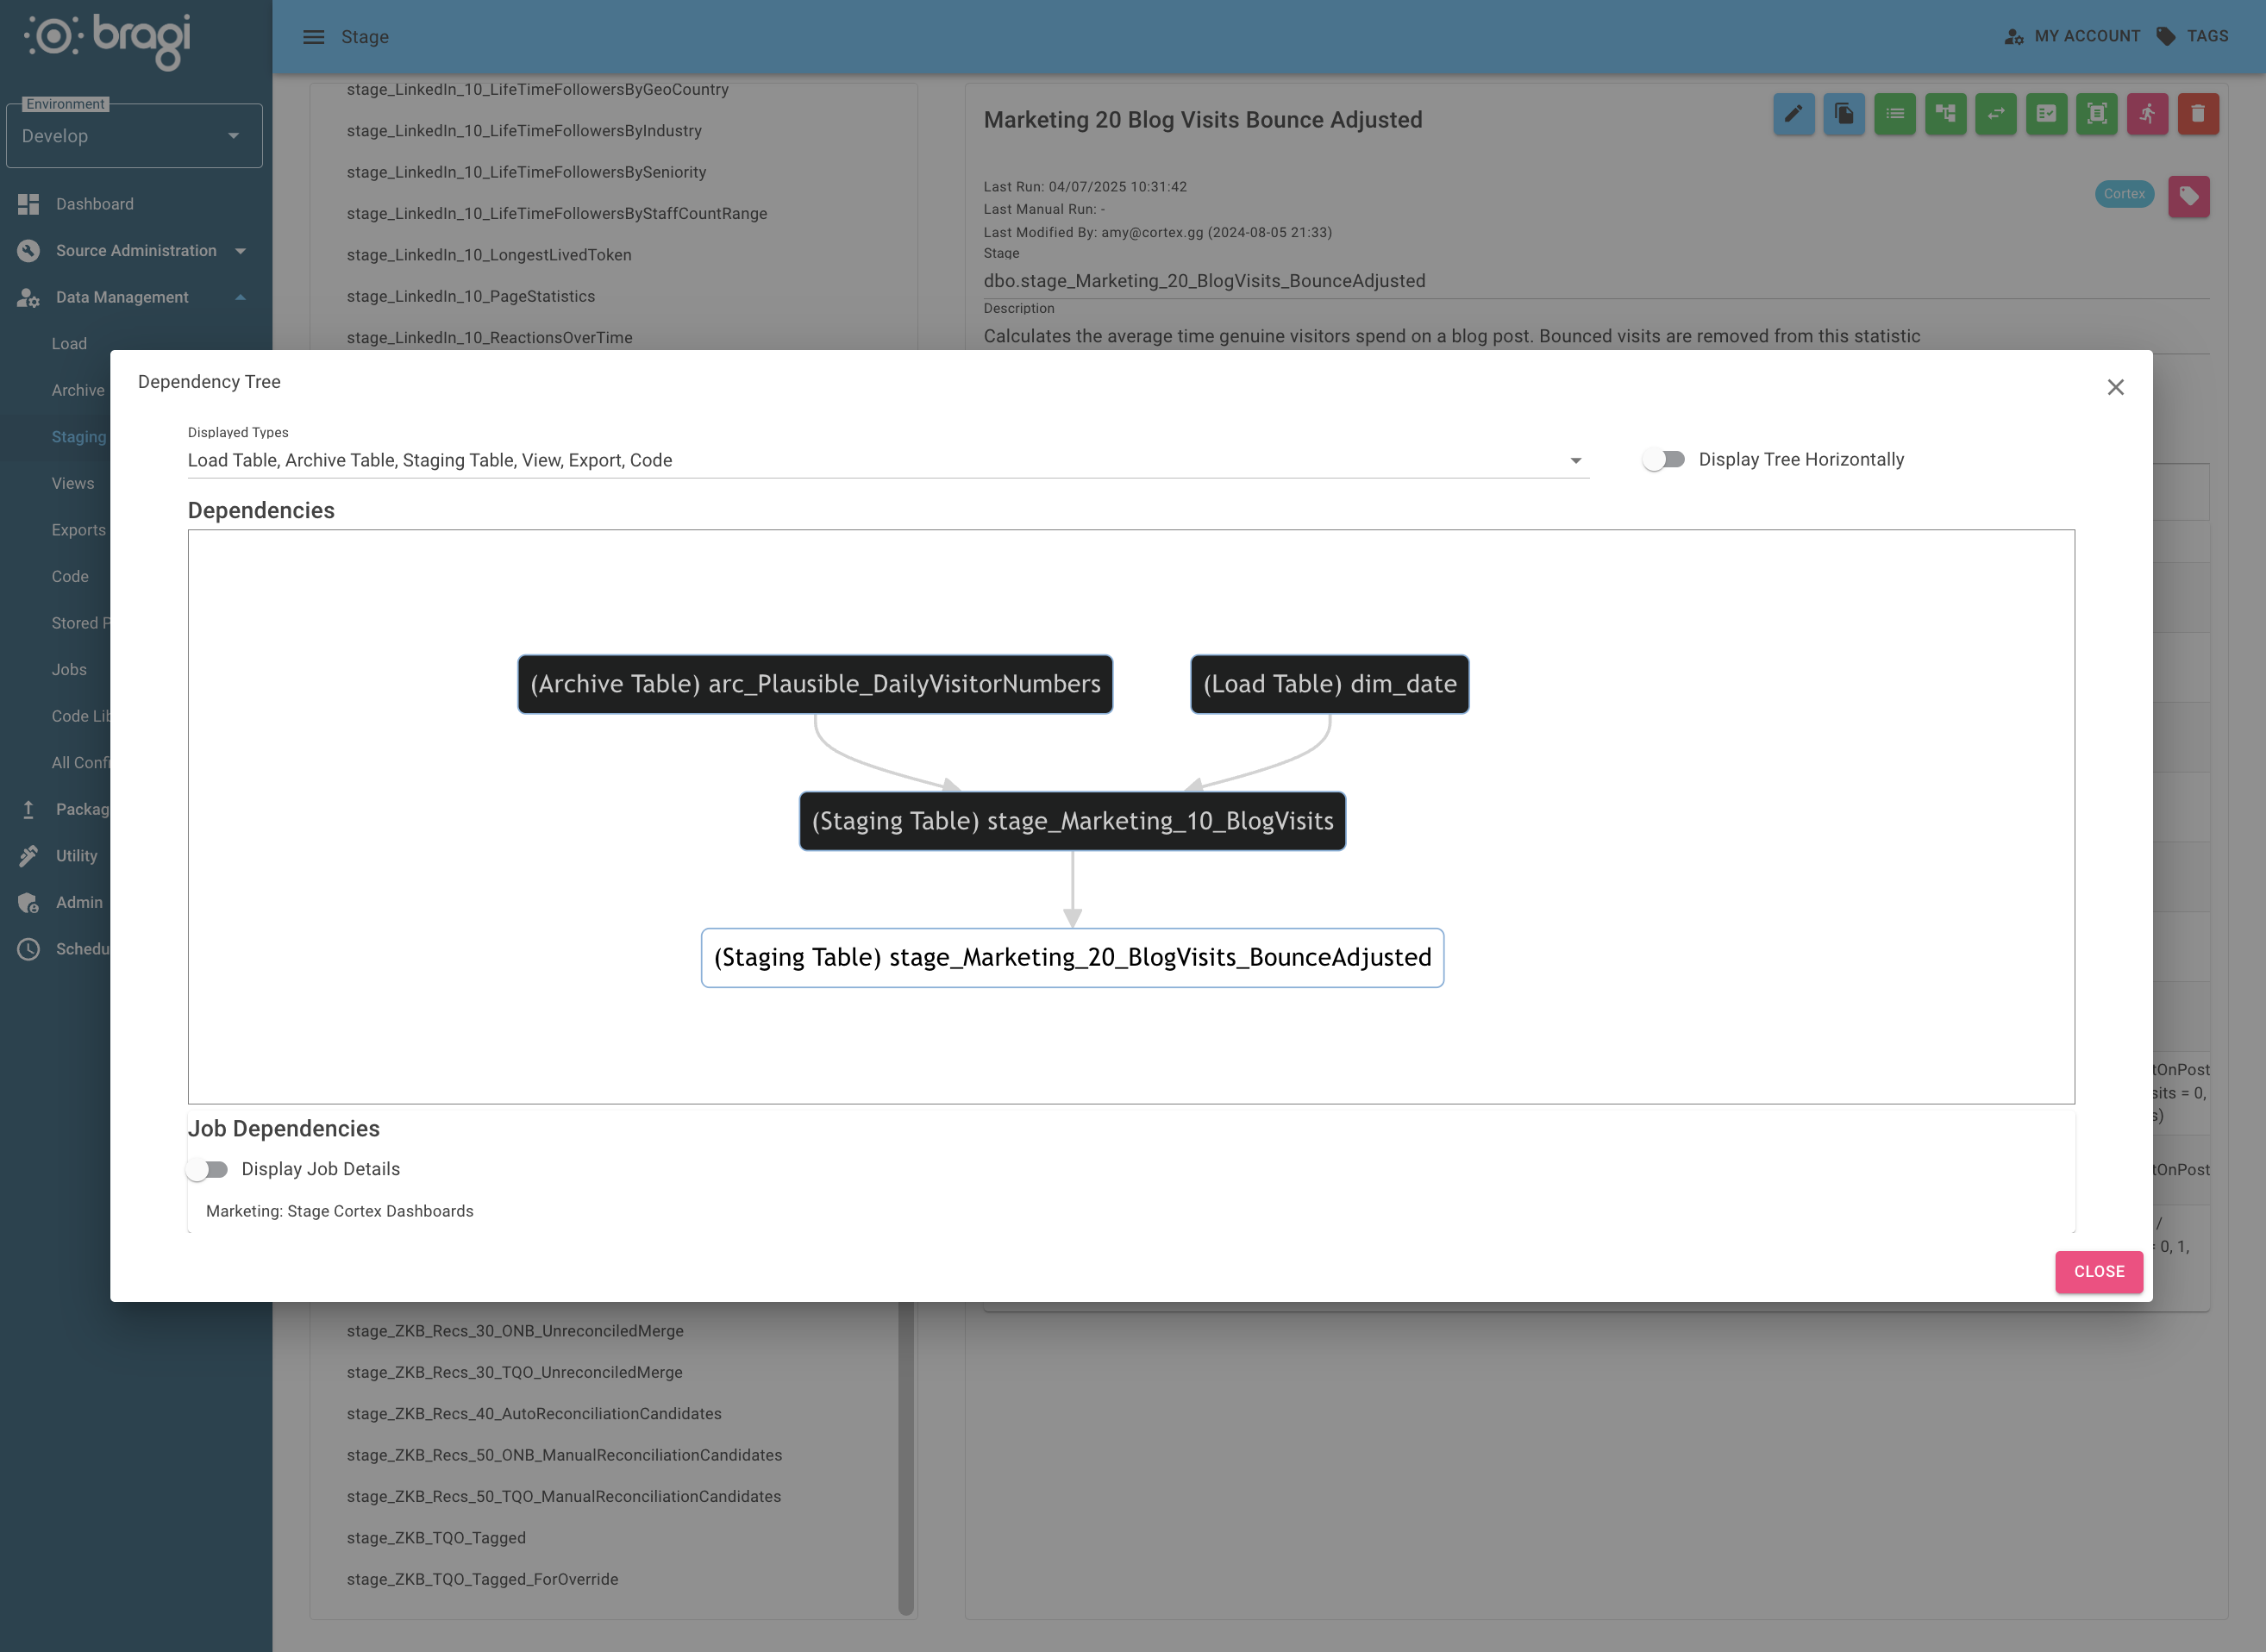
In the image above, the table-level lineage diagram shows the relationships between different tables in a database. It highlights how data flows from one table to another, making it easier to understand the overall structure of the data across systems.
Column or field-level data lineage diagrams
Column-level lineage diagrams offer a more granular view, enabling you to trace the flow of individual data fields or columns from its source through data models and to its final destination. With the granularity of column-level lineage diagrams, it becomes easier to understand where values in a field originate from and ensure data quality at a detailed level.
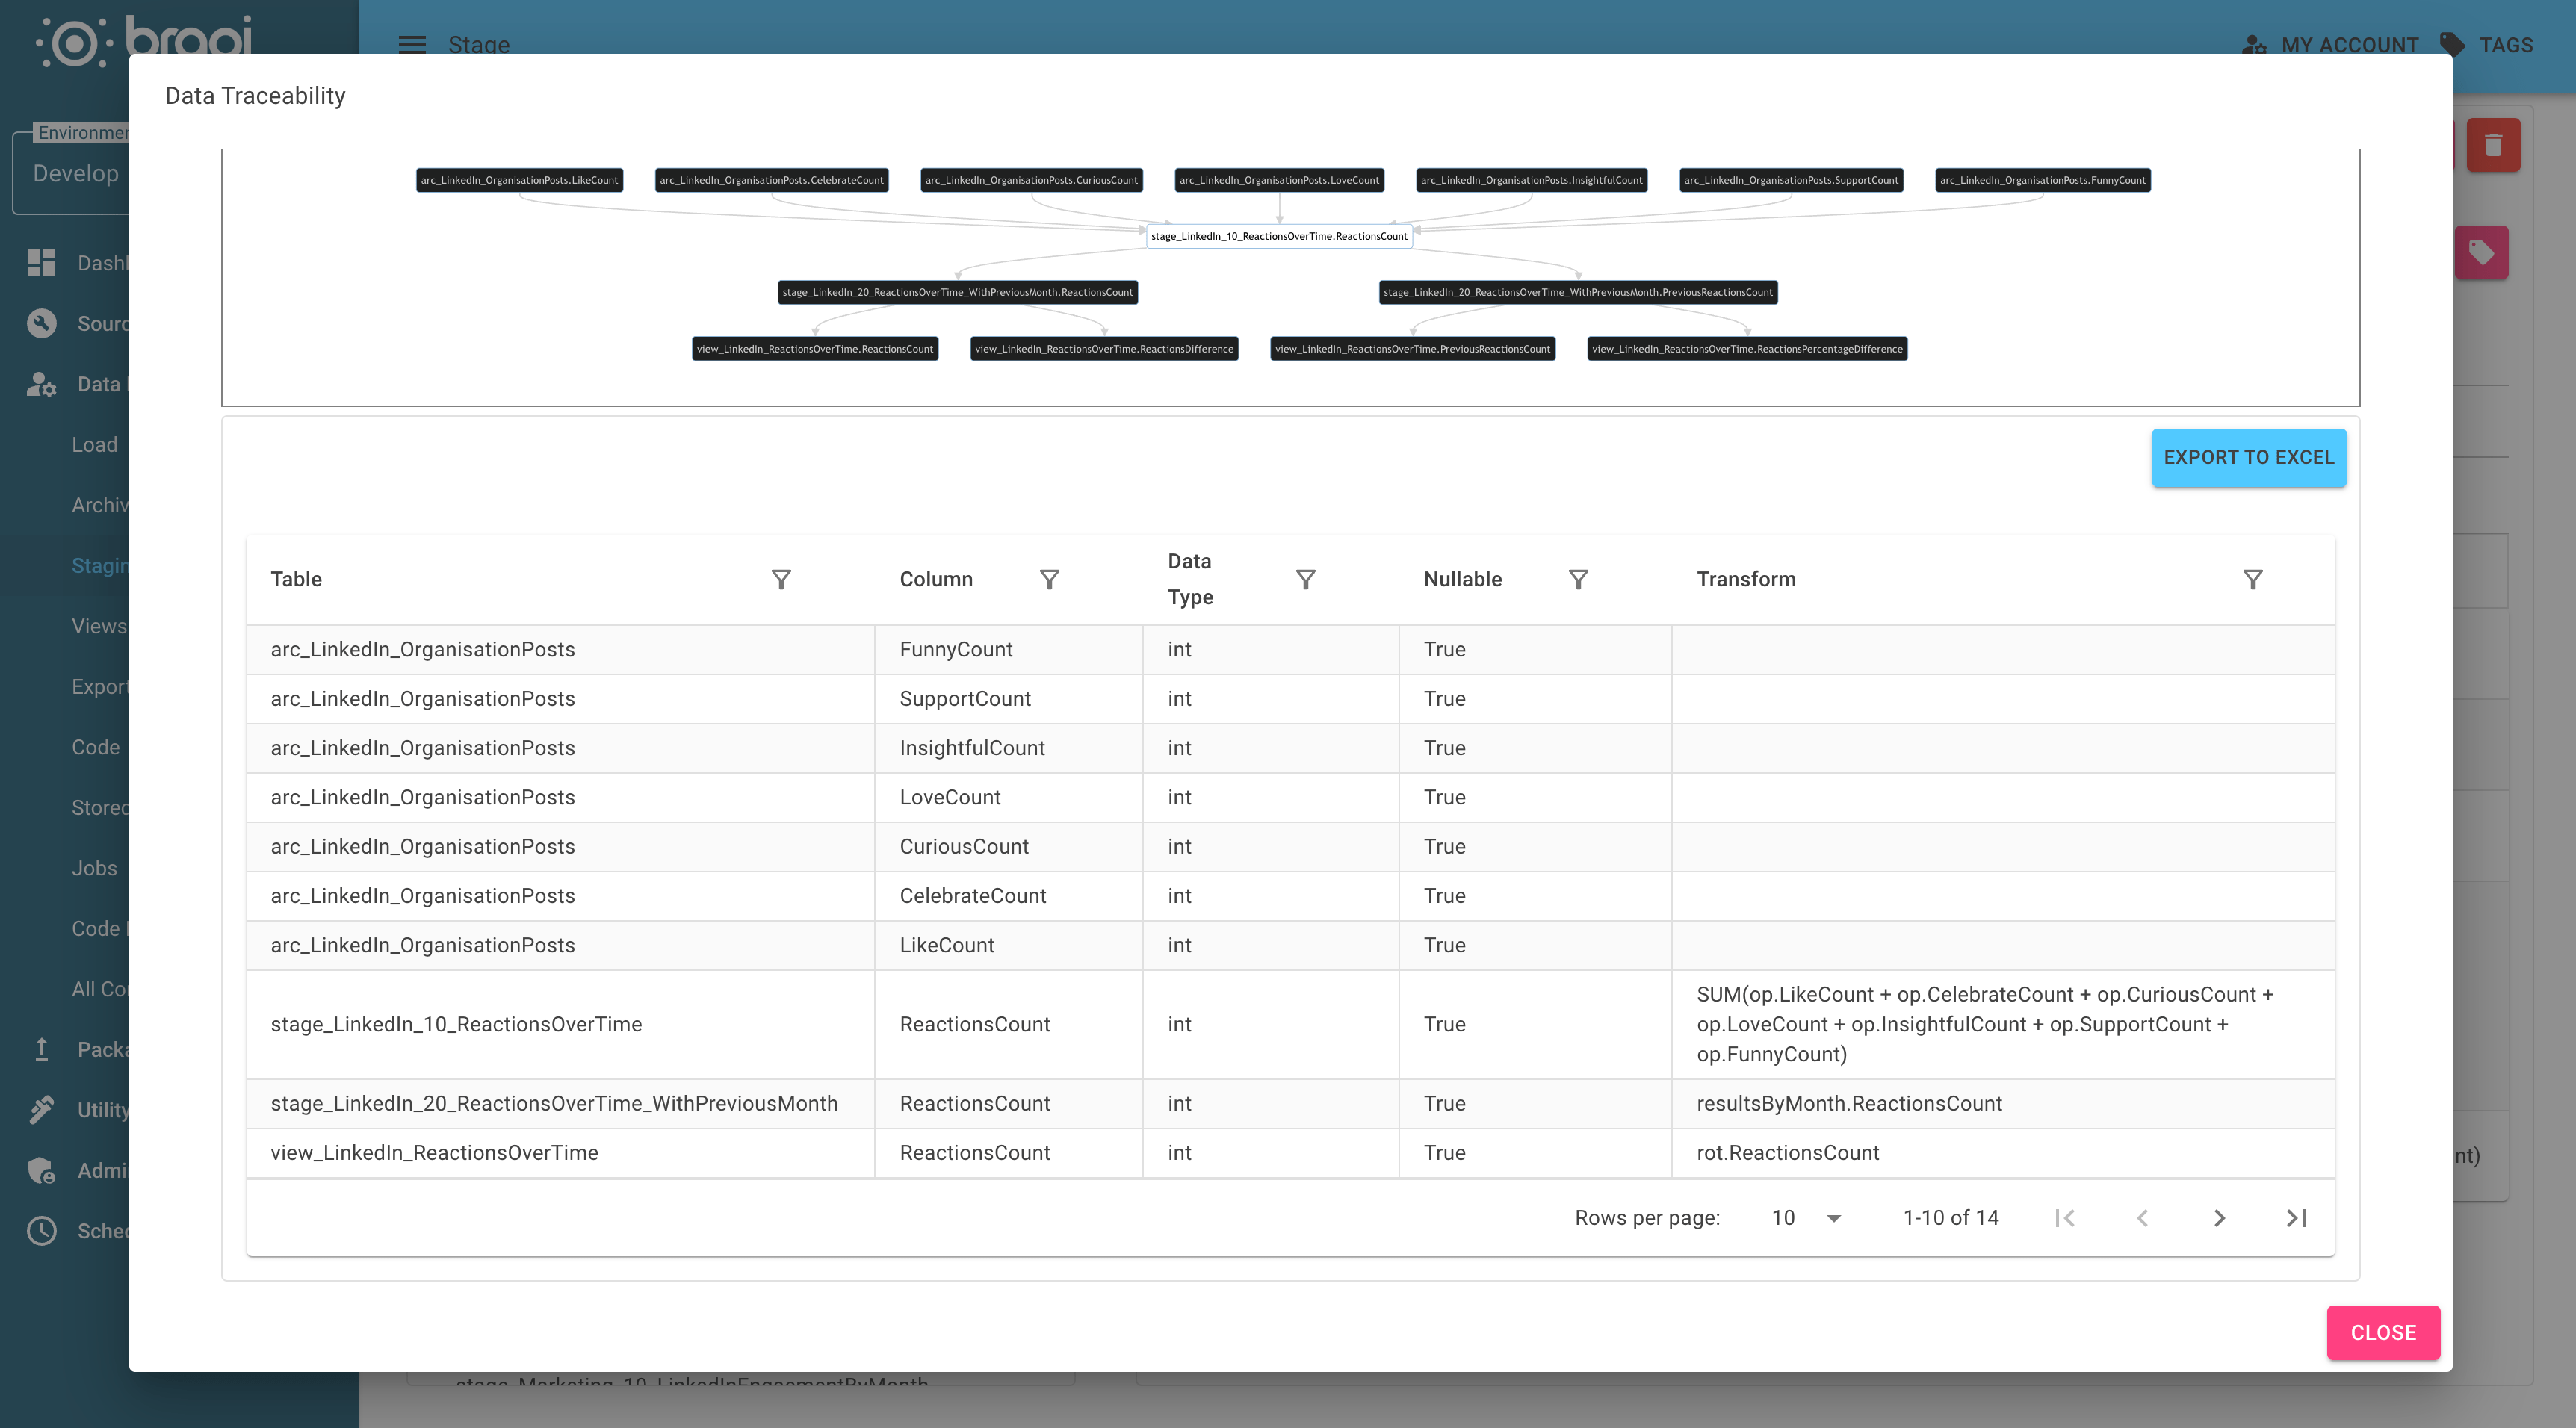
The column-level lineage diagram in the example above tracks the flow of data from its source to its final destination in Bragi. The diagram highlights the transformations and processes the data undergoes, providing a clear understanding of where the data comes from and how it is structured.
The difference between data lineage and data provenance
Data lineage is a visual tool that tracks the movement and transformations of data through various systems, processes, and applications. Data provenance is the record of metadata from data’s original sources, providing the historical context and authenticity of data.
How data lineage diagrams improve data quality
Data lineage diagrams play an important role in improving data quality. With data lineage diagrams, data engineers can:
1. Analyse impact before making model changes
Data lineage diagrams help map and visualise dependencies between datasets and transformations and uncover hidden dependencies that might not be immediately obvious.
For example, if a transformation process in a data pipeline is modified, a data lineage diagram can highlight all downstream reports and systems that rely on the affected data. This visibility lets data engineers and developers assess the potential ripple effects of changes, ensuring that updates are implemented without disrupting critical workflows or compromising data integrity.
2. Detect “data smells” and speed up debugging
“Data smells,” a term explored in this article, are patterns that indicate potential data quality issues, such as inconsistent formats, null values, or overly complex transformations. These smelly issues can disrupt workflows and lead to unreliable insights.
Data lineage diagrams make it easier to find the root cause of data smells and help engineers quickly navigate to where problems in the data pipeline originate from, whether it’s a faulty upstream source or a transformation step gone wrong.
Data lineage diagrams make data smells easier to detect and troubleshoot, streamline the debugging process, reduce downtime, and improve overall data quality.
3. Provide a clear audit trail
Data lineage diagrams make it easier to demonstrate compliance with regulations. For example, in the context of GDPR, data lineage diagrams can help organisations track the flow of personally identifiable information (PII) and ensure that data is handled according to legal requirements.
Data lineage diagrams map the flow of PII data from its collection point (e.g., a checkout form) through various systems, such as the CRM, data warehouse, and reporting tools. This provides a clear view of where PII is stored, processed, and used. By visualising dependencies, data engineers can identify which downstream systems rely on PII data.
With data lineage diagrams, auditors can verify data integrity and accuracy, ensuring organisations meets regulatory standards.
How to make the most out of data lineage diagrams
To maximise the benefits of data lineage diagrams, consider the following best practices:
Trace fields with column-level lineage
Table-level lineage diagrams are useful for providing a high-level overview of data movement, but they lack the granularity needed to understand the flow of individual fields.
Make sure to include column-level lineage in the data lineage diagram to enable detailed tracking of individual fields. This level of granularity helps to detect the origins of specific values in models quickly and ensure data quality.
Add context to data lineage diagrams
We mentioned earlier that data lineage diagrams are essential for understanding the flow of data within an organisation. Without context, however, data lineage diagrams are difficult to interpret and can’t provide the necessary insights for effective data governance.
By adding context to data lineage diagrams, such as model ownership and versioning, data engineers can better understand the relationships between different data models and how they impact each other.
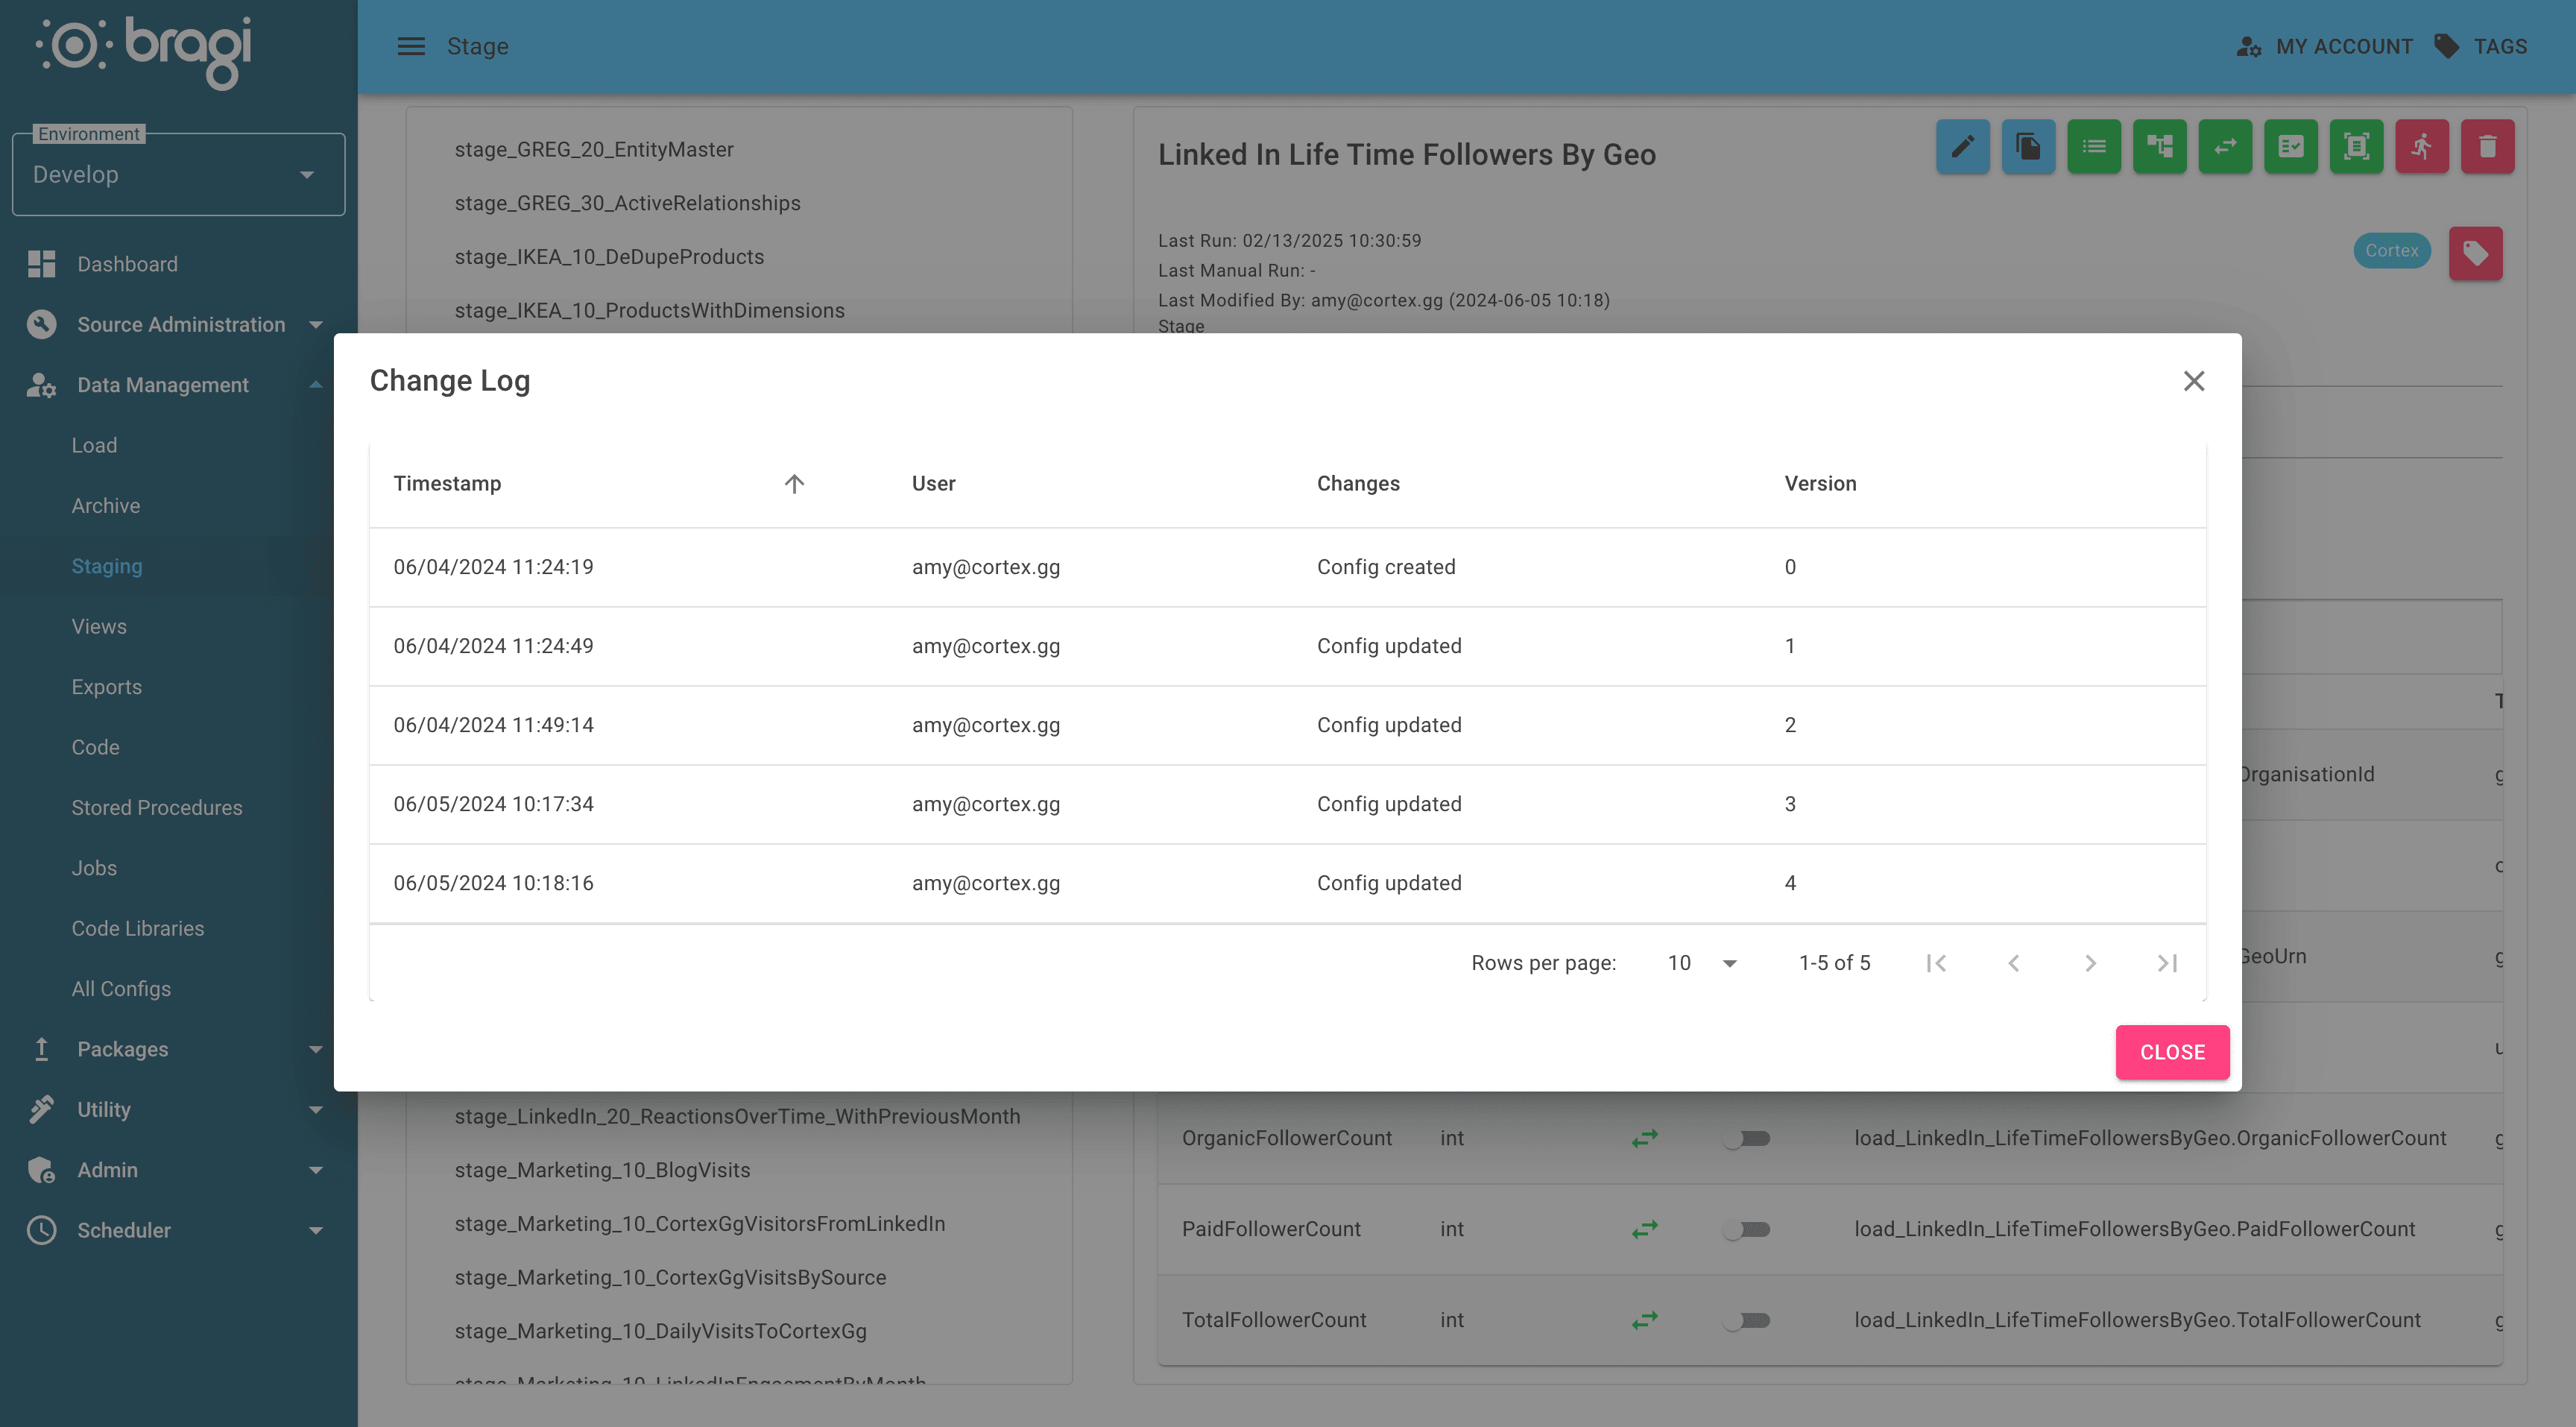
In Bragi, model versions are automatically tracked and versioned, allowing you to roll back to previous states of your data models. This feature is particularly useful for debugging and auditing purposes, as it provides a clear history of changes made to the data models over time.
Use automation to scale data lineage diagrams
Scaling data lineage efforts is crucial. Automated tools help manage the increasing complexity, ensuring that lineage documentation remains current and accurate as new data sources and transformations are added. When looking for a data lineage diagram tool, consider the following features:
-
Automated lineage capture: look for tools that automatically capture data lineage as data flows through the system.
-
Integration with existing systems: choose a tool that seamlessly integrates with your current data stack, including databases, ETL tools, and BI platforms.
-
User-friendly visualisations: opt for tools that provide intuitive and navigational visualisations of data lineage, so engineers and auditors can easily trace tables and fields.
Automate data lineage and documentation with Bragi
Bragi is a data automation platform that provides automated data lineage diagrams and documentation, allowing you to easily track the flow of data through your systems. With Bragi, you can create and manage data lineage diagrams that are automatically updated as your data changes, ensuring that you always have an accurate view of your data across all systems.
See Bragi in action
Learn more about Bragi’s automated data lineage features in a personalised demo
Speak directly to Bragi’s co-founders, not a sales agent, and explore how Bragi can consolidate data governance and compliance across your data stack.
How do data lineage diagrams assist in compliance audits?
+What is the difference between table-level and column-level data lineage diagrams?
+Can data lineage diagrams be automated?
+